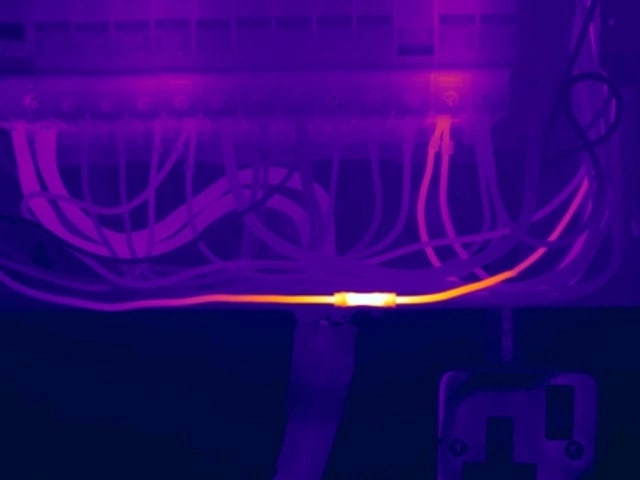
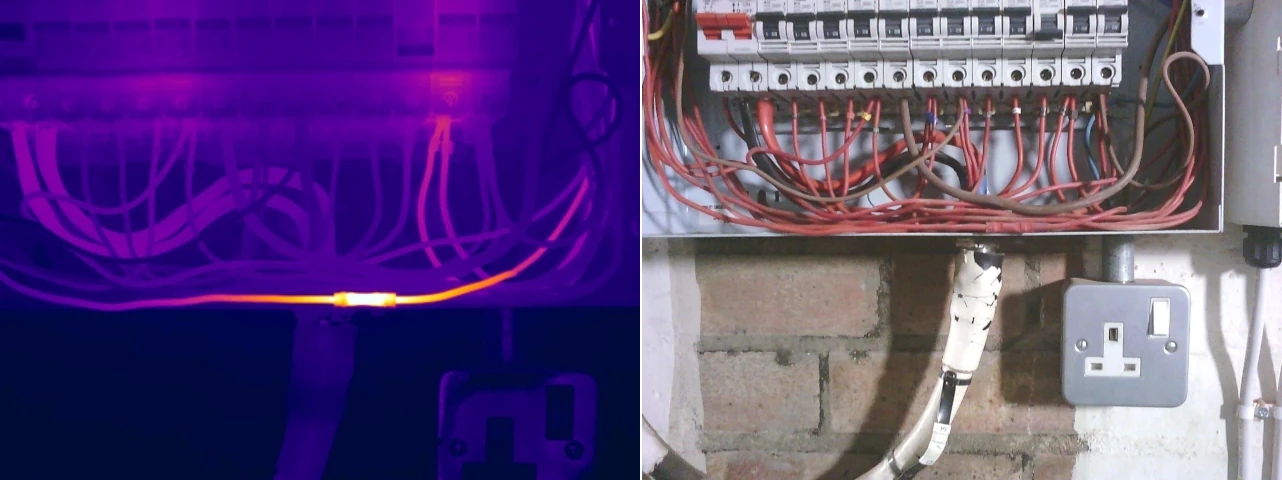
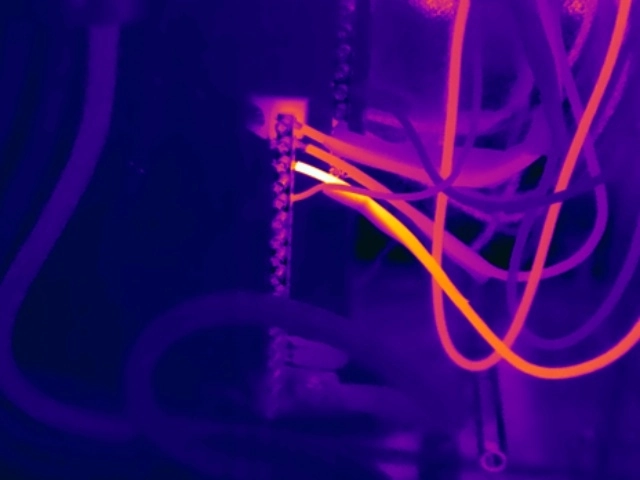
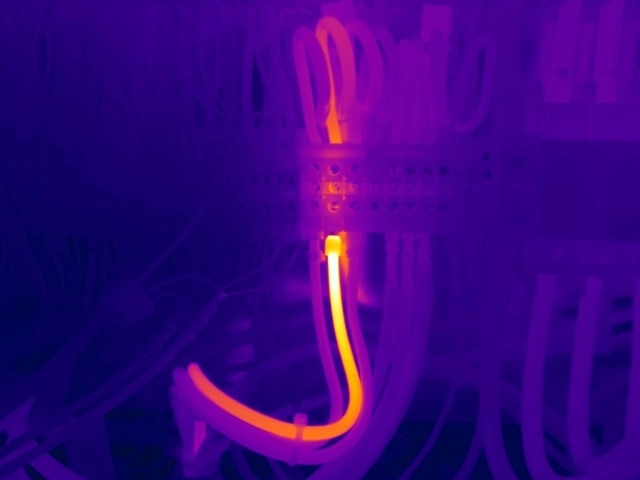
Loose Electrical Connections
Explore real thermal examples, causes, interpretation guidance and corrective-action considerations for loose connection anomalies.
Read the GuideElectrical thermal imaging surveys are designed to identify developing faults within live electrical systems by detecting abnormal heat patterns. While many electrical defects remain hidden during visual inspections or routine electrical testing, thermal imaging allows issues to be identified whilst equipment is energised and operating under normal load conditions.
Electrical faults rarely occur without warning. In many cases, deteriorating electrical components generate increasing levels of heat long before they fail completely. Thermal imaging makes these issues visible, allowing maintenance teams to take corrective action before faults result in equipment damage, unplanned downtime or fire.
From distribution boards, switchgear and motor control centres through to transformers, busbar systems and high voltage substation equipment, thermal imaging provides valuable insight into the condition of electrical infrastructure. By identifying developing faults before they result in failure, thermal imaging plays an important role in modern predictive maintenance strategies, helping organisations improve reliability, reduce risk and support the long-term performance of critical electrical systems.
Electrical thermal imaging surveys provide a non-invasive means of assessing live electrical infrastructure under representative operating conditions.
Each fault type below links to a dedicated technical guide containing additional thermal examples, fault-specific interpretation and maintenance considerations. Start with the common electrical faults overview, then use the individual guides to explore the anomalies most relevant to your electrical assets.
Electrical current flowing through a conductor naturally generates heat. Under normal operating conditions this heat is predictable and remains within acceptable limits for the equipment being operated.
When electrical faults develop, resistance often increases, causing additional energy to be released as heat. This can result in individual connections, conductors or components operating at higher temperatures than expected. Thermal imaging identifies these abnormal temperature rises by comparing the thermal behaviour of similar components operating under similar conditions.
Not all thermal anomalies are caused by electrical faults. Excessive electrical loading can also cause elevated temperatures, even when equipment is functioning correctly. In these situations, thermal imaging may indicate wider issues such as increasing demand, changing operational requirements, poor load distribution or equipment operating beyond its intended capacity.
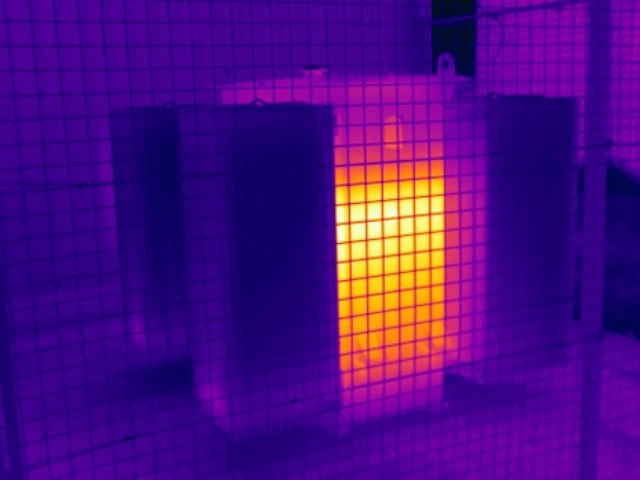
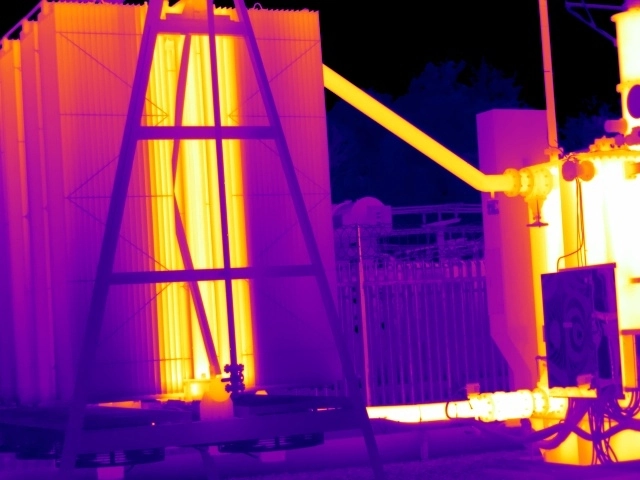
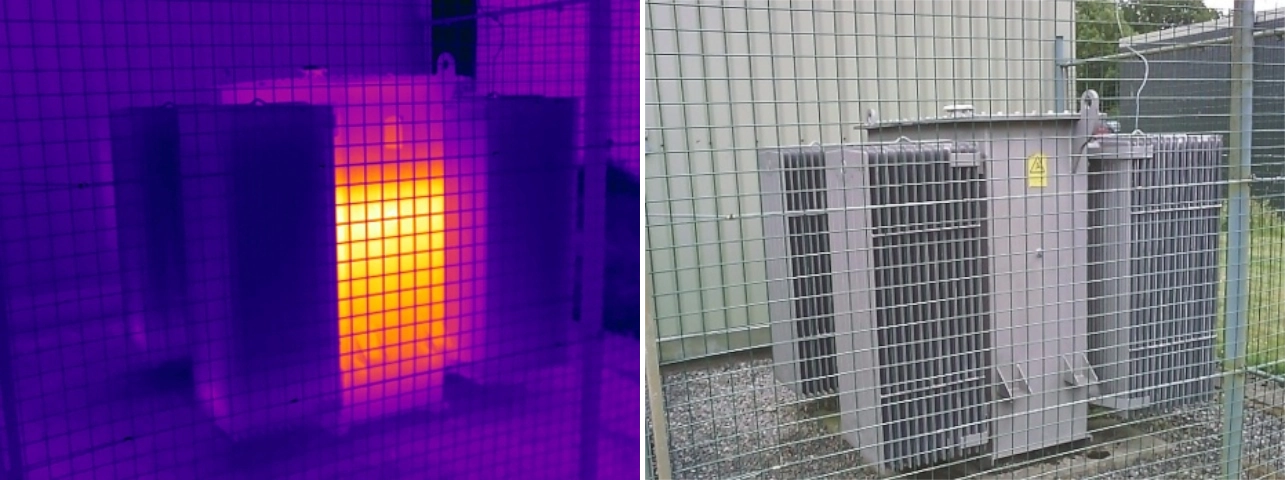
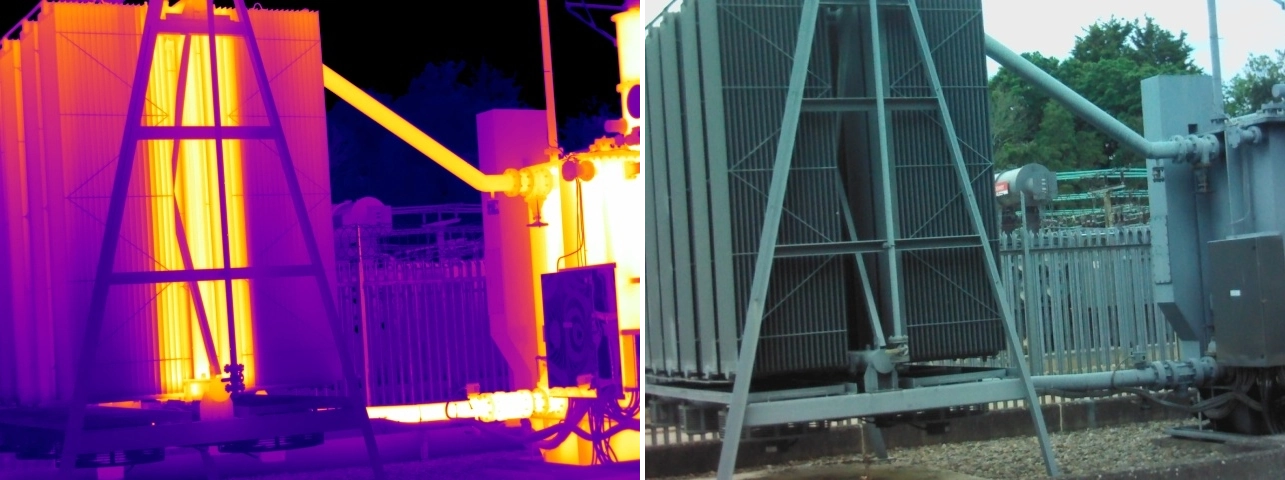
Equally, thermographers are not solely looking for hotspots. Some defects can appear as unexpected cool areas when compared to similar equipment. Examples include blocked transformer cooling radiators, failed cooling fans or impaired cooling systems that alter the normal thermal profile of an asset.
For this reason, thermal imaging focuses on identifying abnormal thermal behaviour rather than simply locating the hottest component. This enables both developing faults and operational issues to be identified before they result in equipment damage, reduced reliability, unplanned downtime or fire hazards.
Common causes of abnormal thermal conditions include:
Electrical thermal imaging surveys routinely identify a variety of developing faults within live electrical systems. Common issues include loose connections, high-resistance joints, overloaded circuits, phase imbalance, deteriorating switchgear components, and defects within transformers or busbar systems.
The examples below explain how these faults typically develop, how they appear through thermal imaging, and the potential consequences if corrective action is not taken.
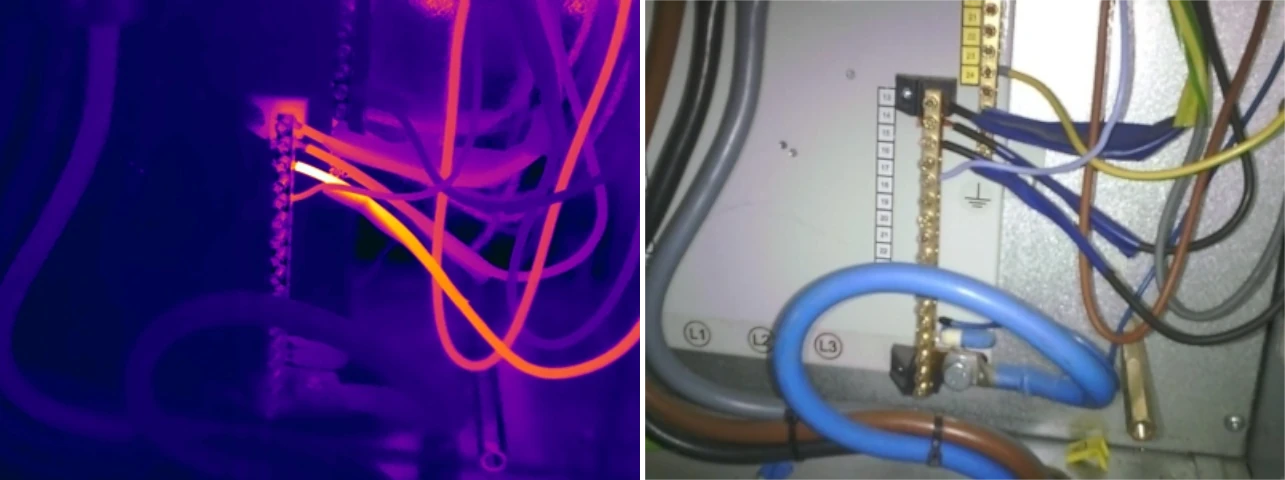
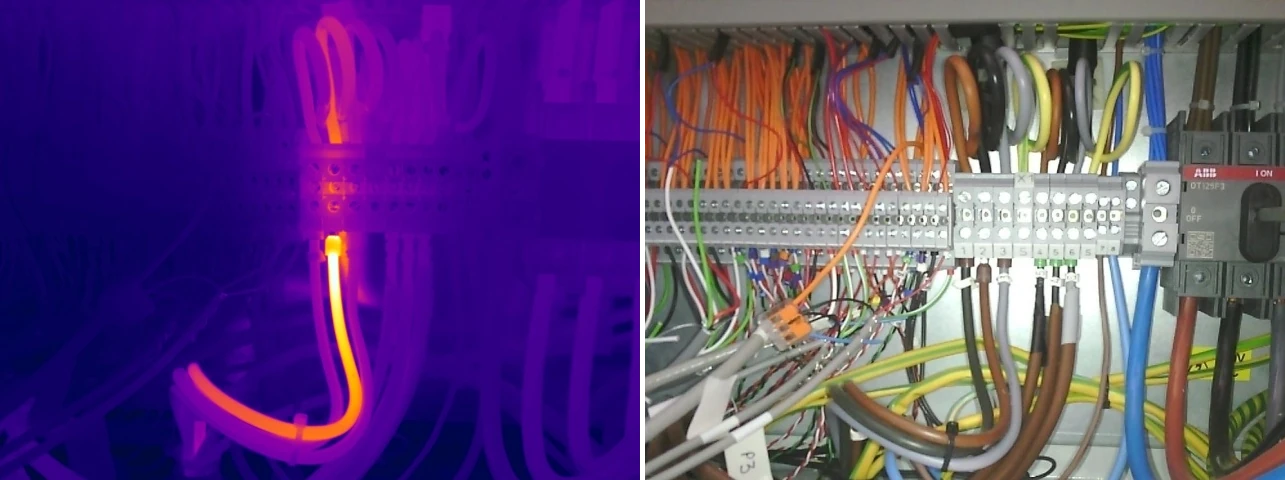
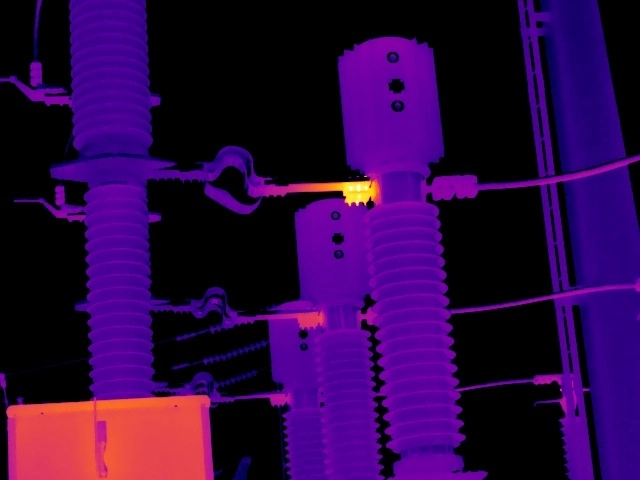
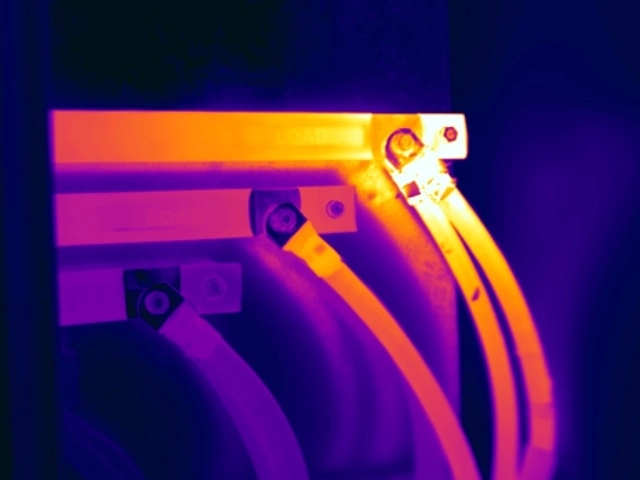
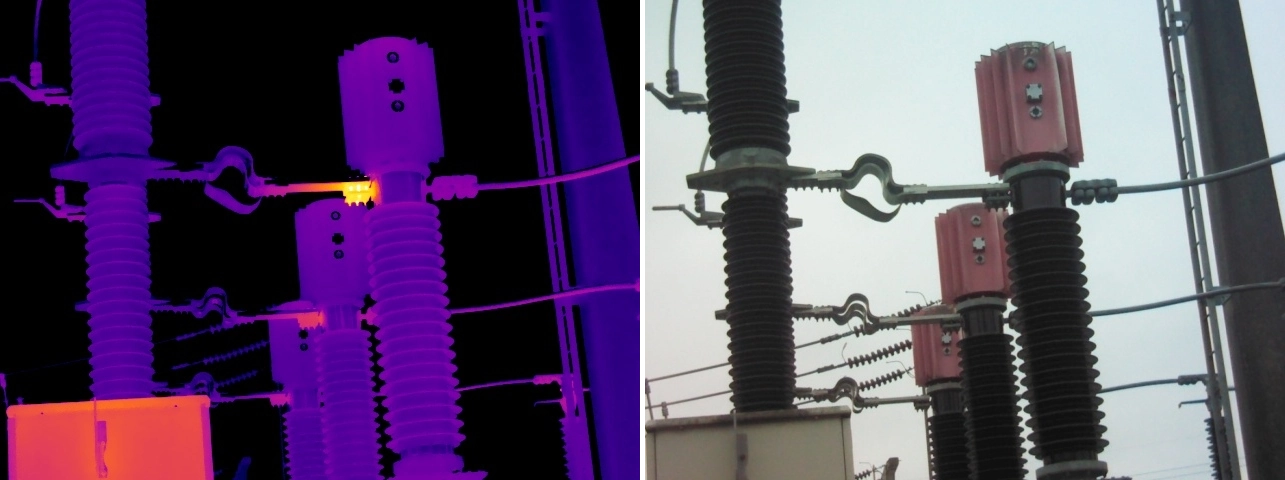
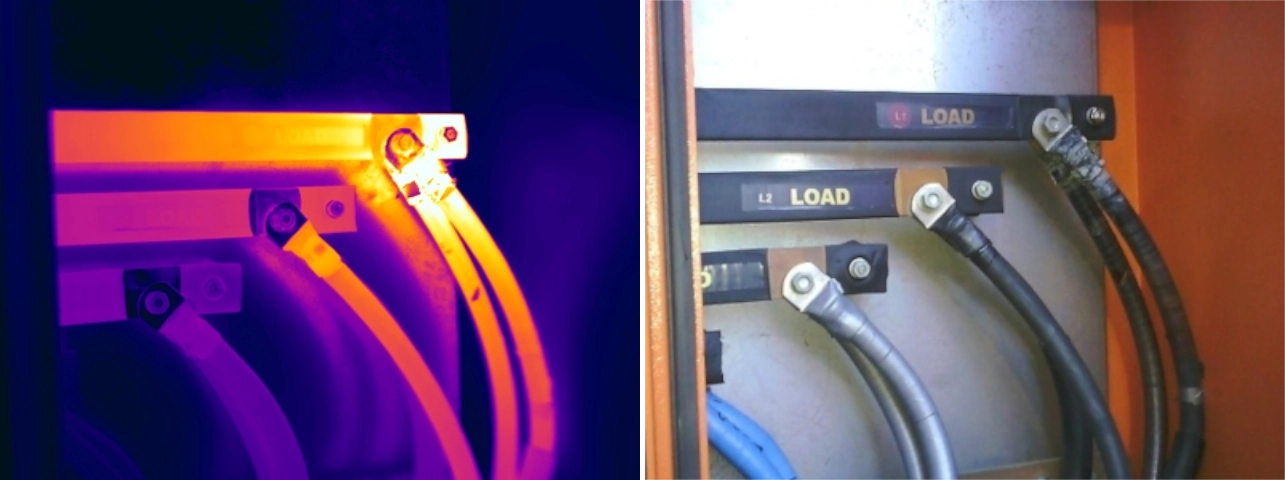
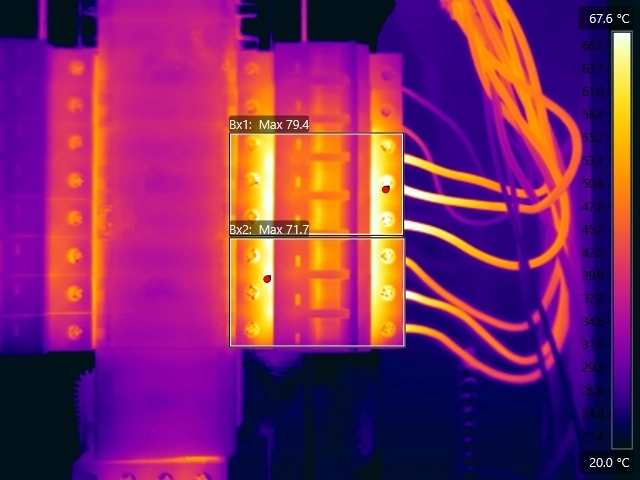
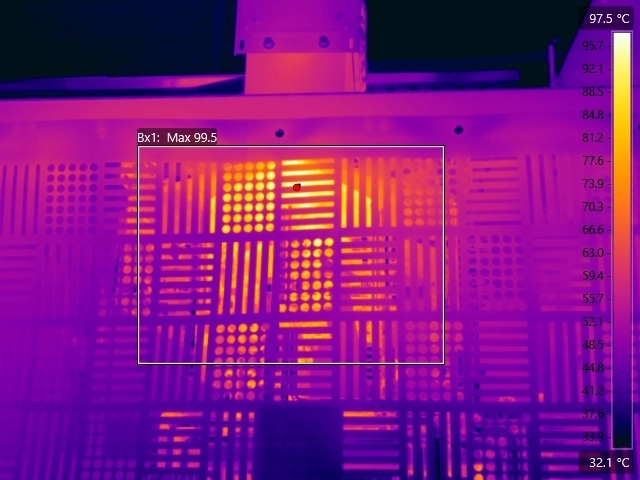
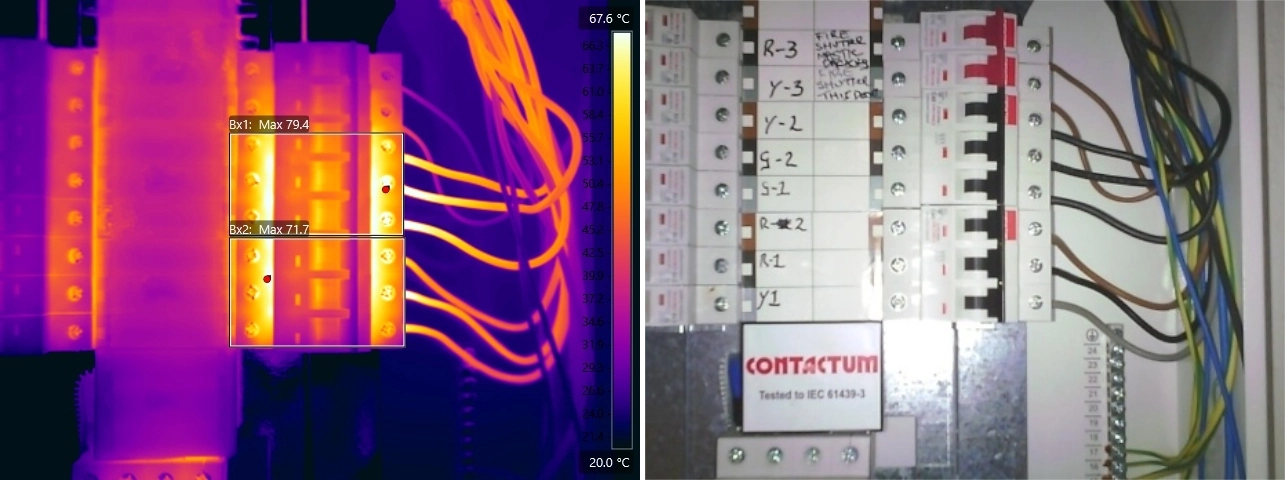
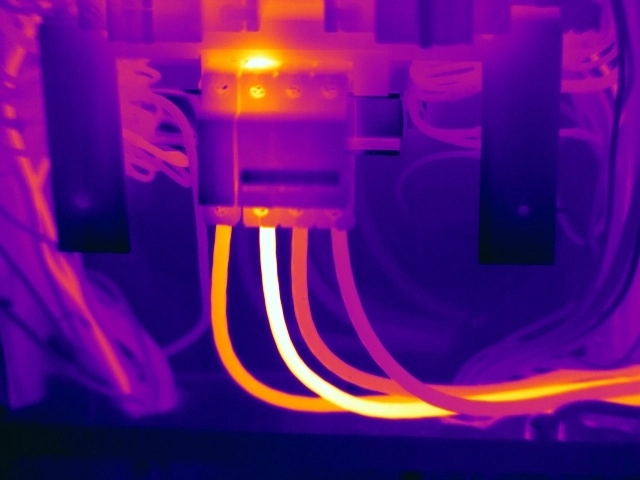
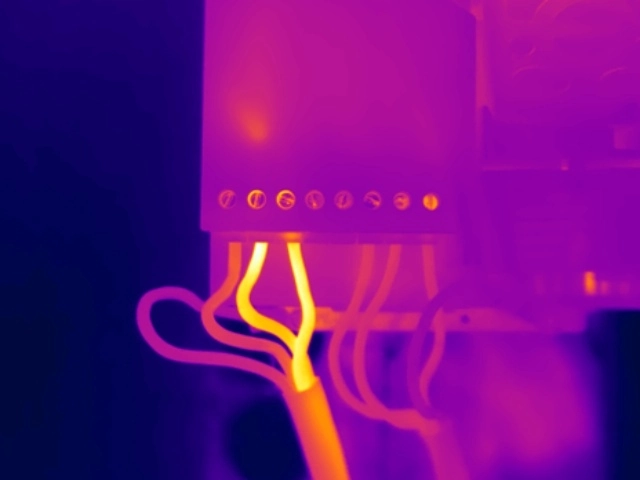
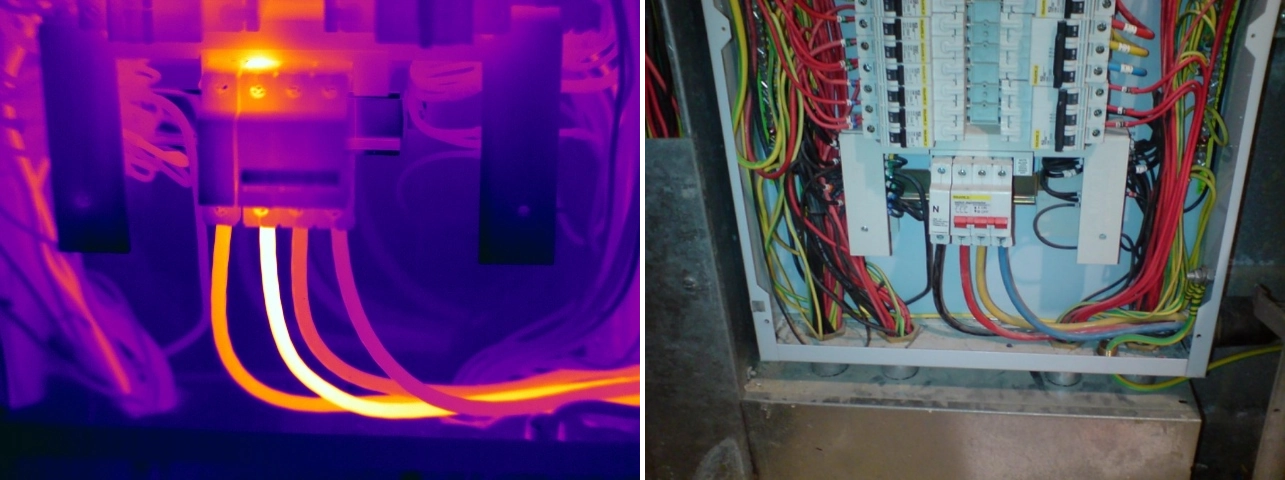
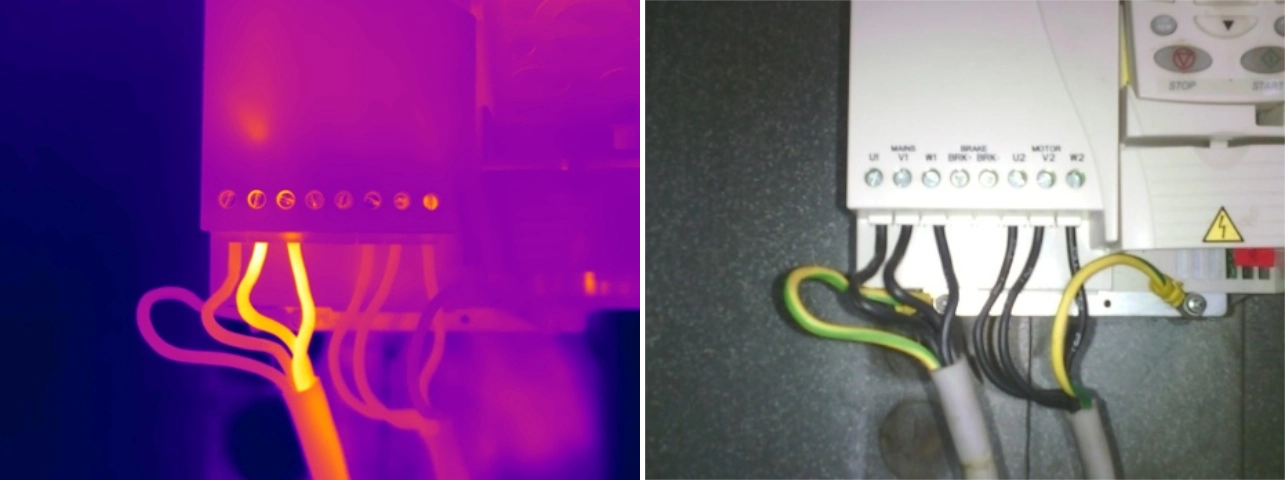
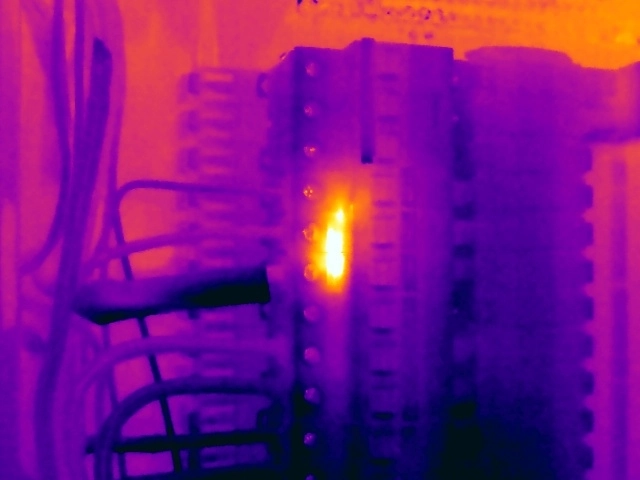
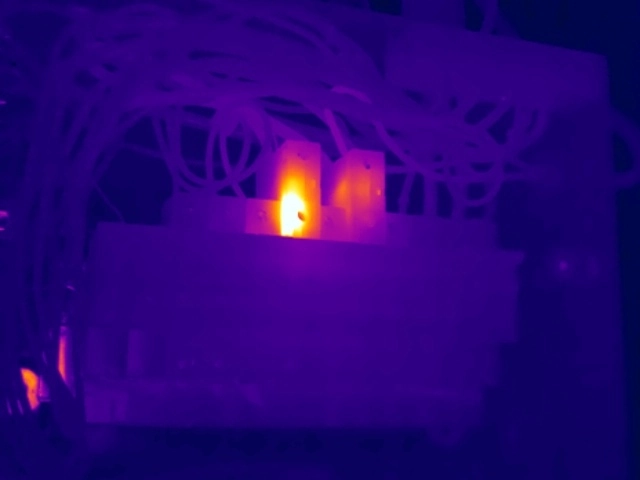
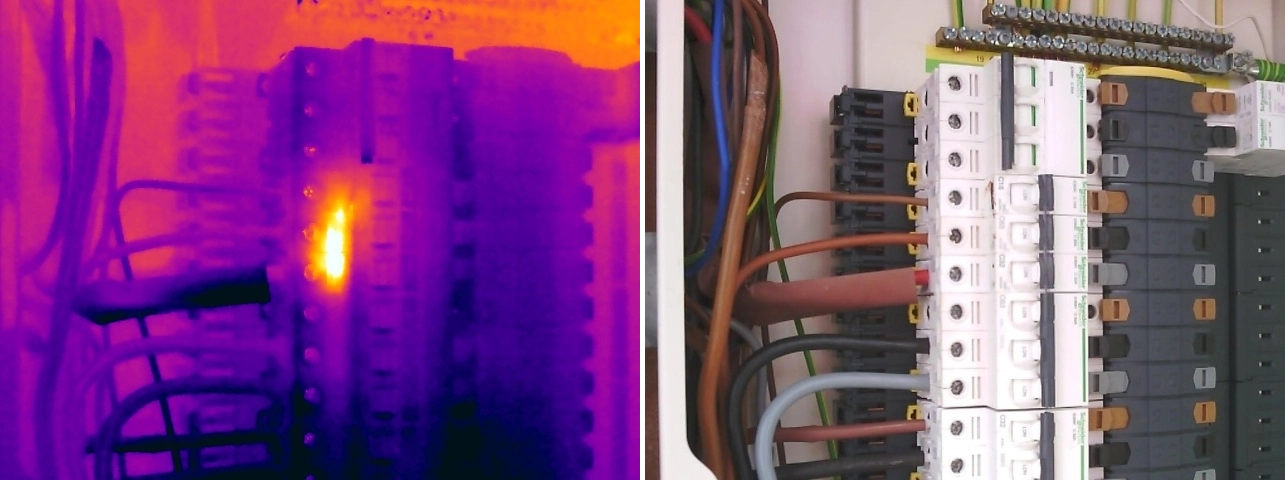
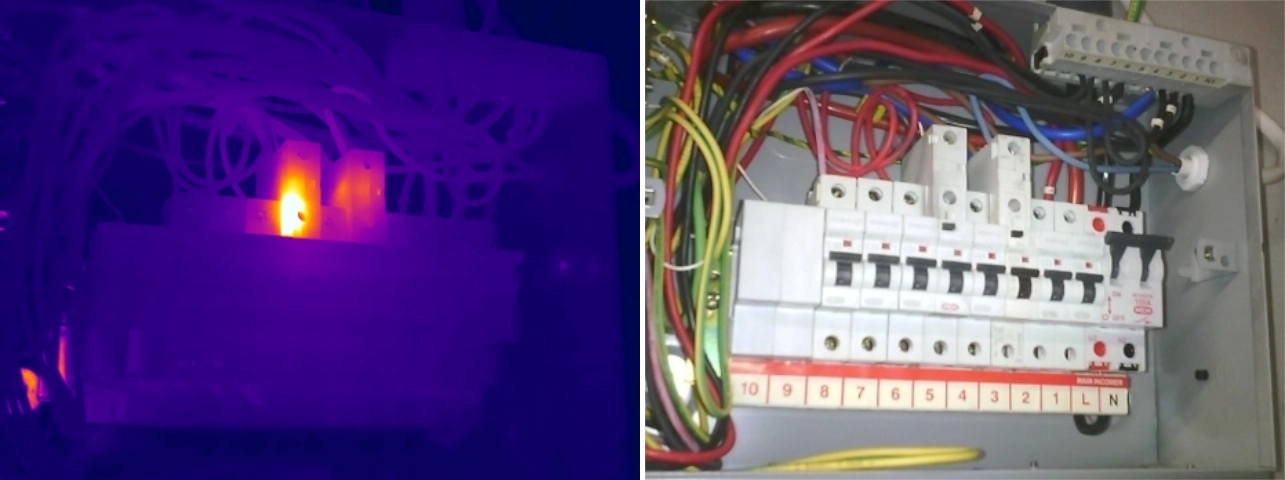
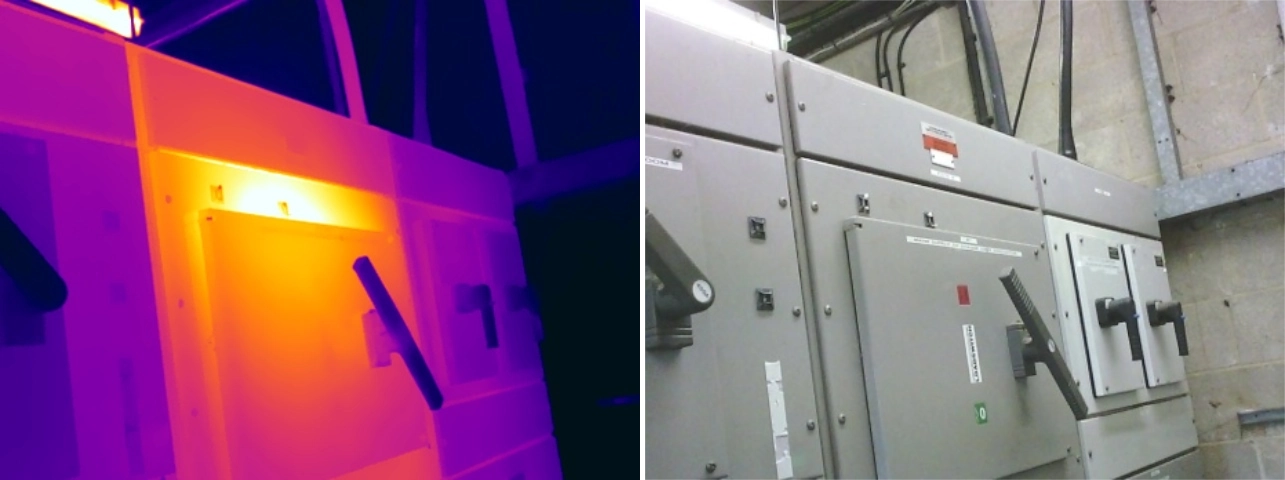
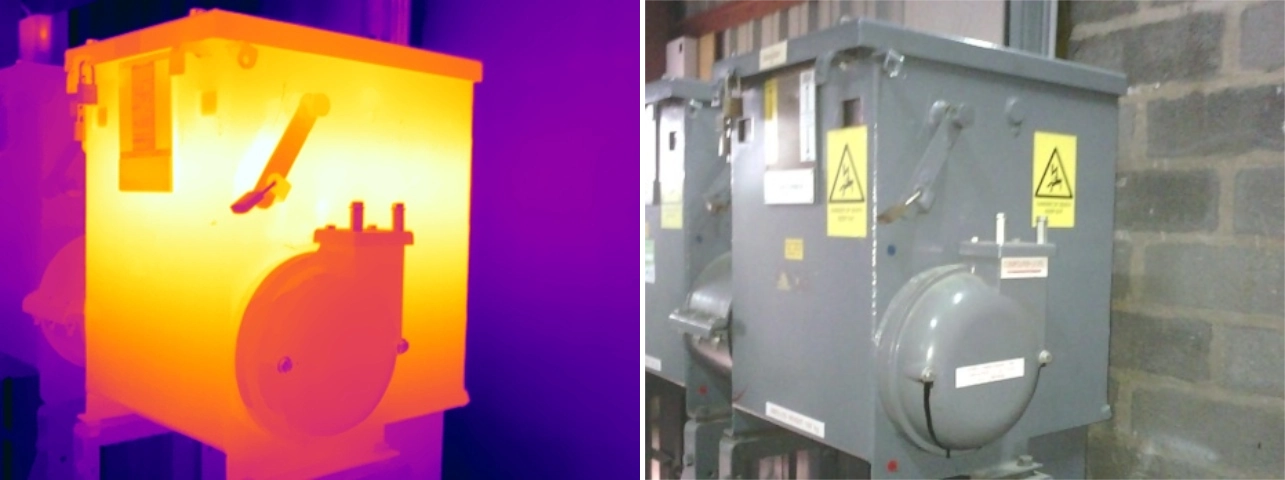
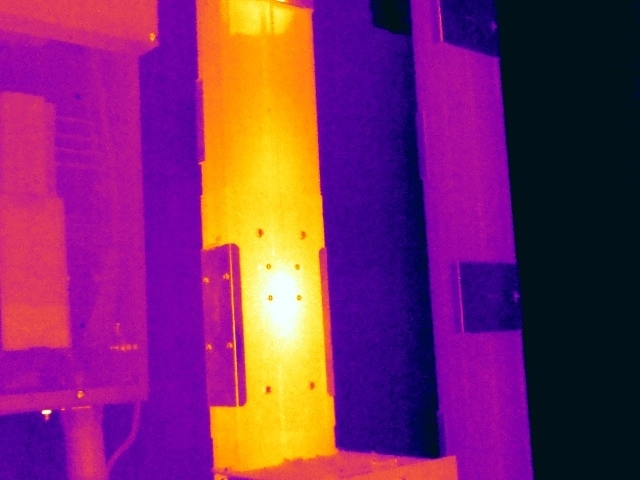
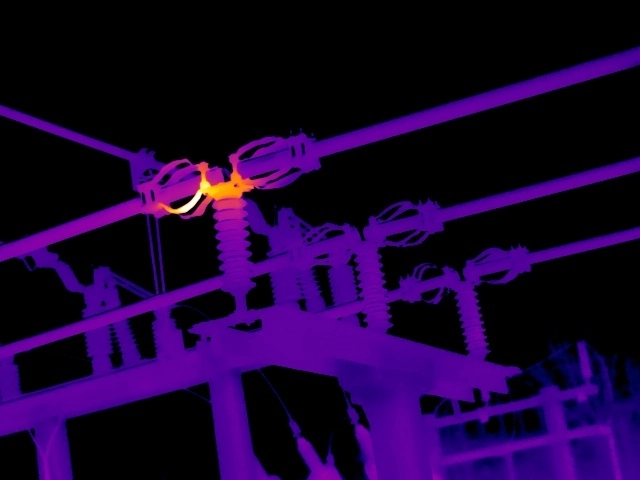
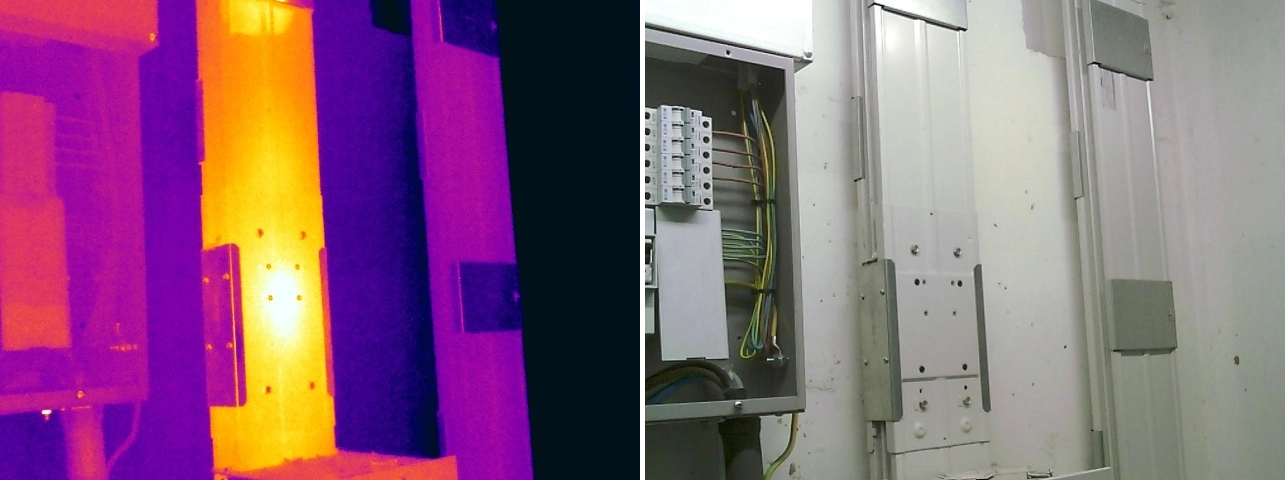
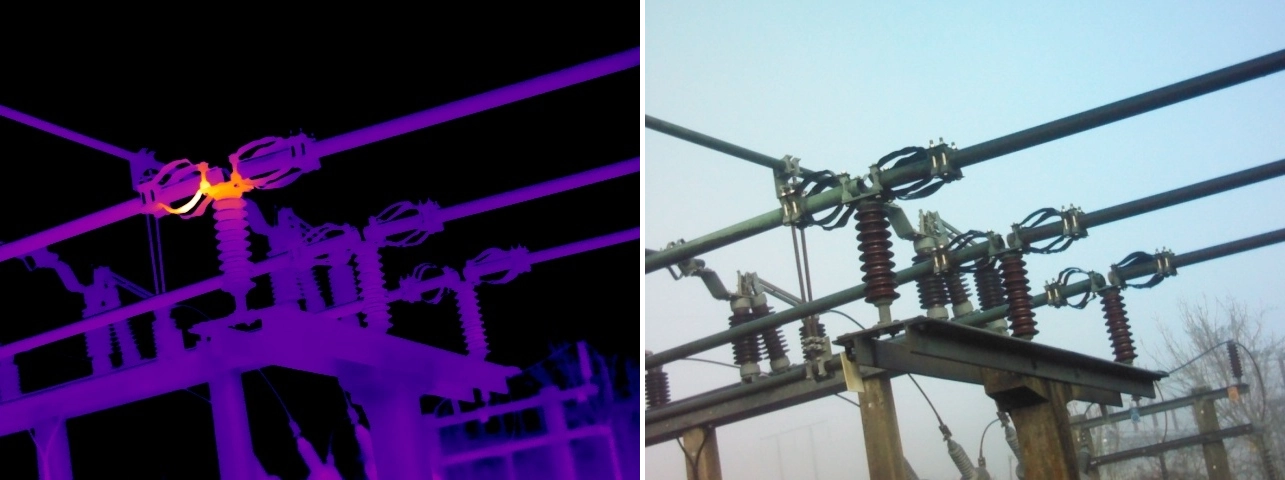
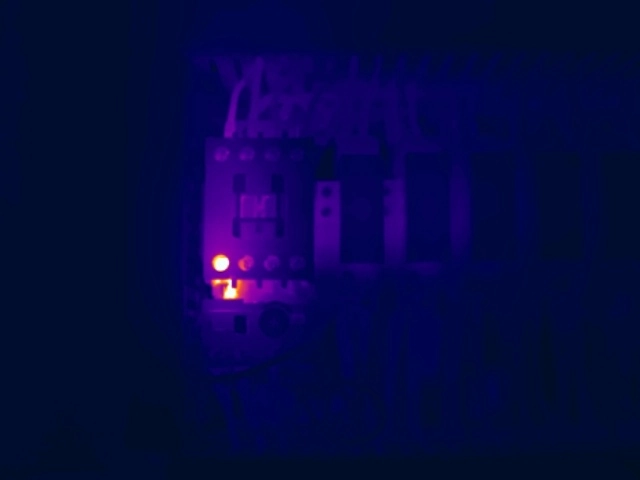
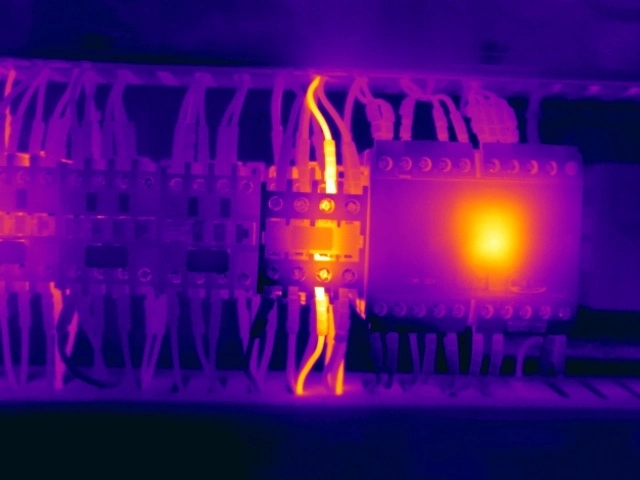
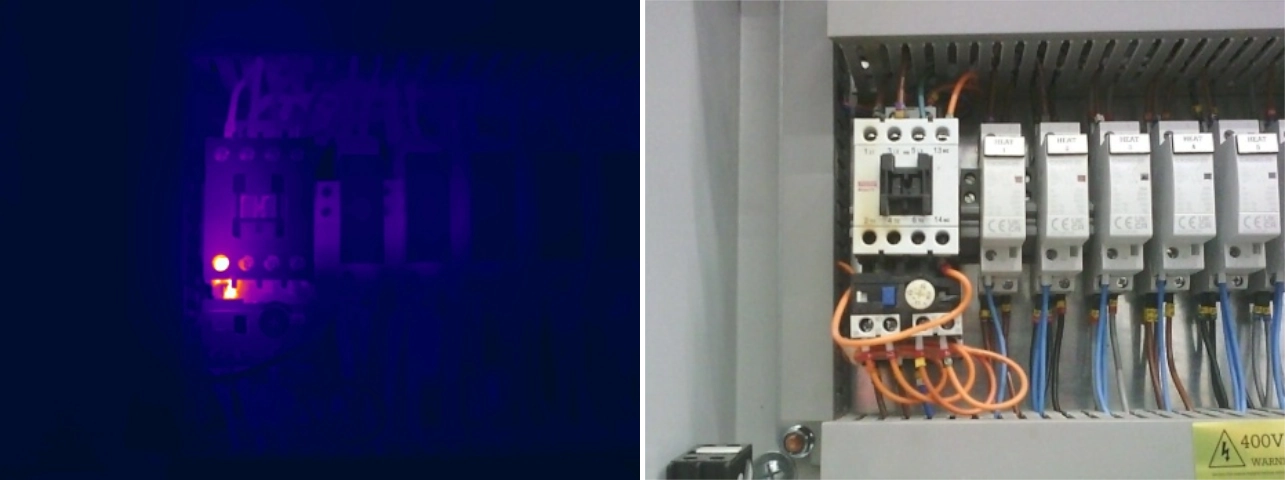
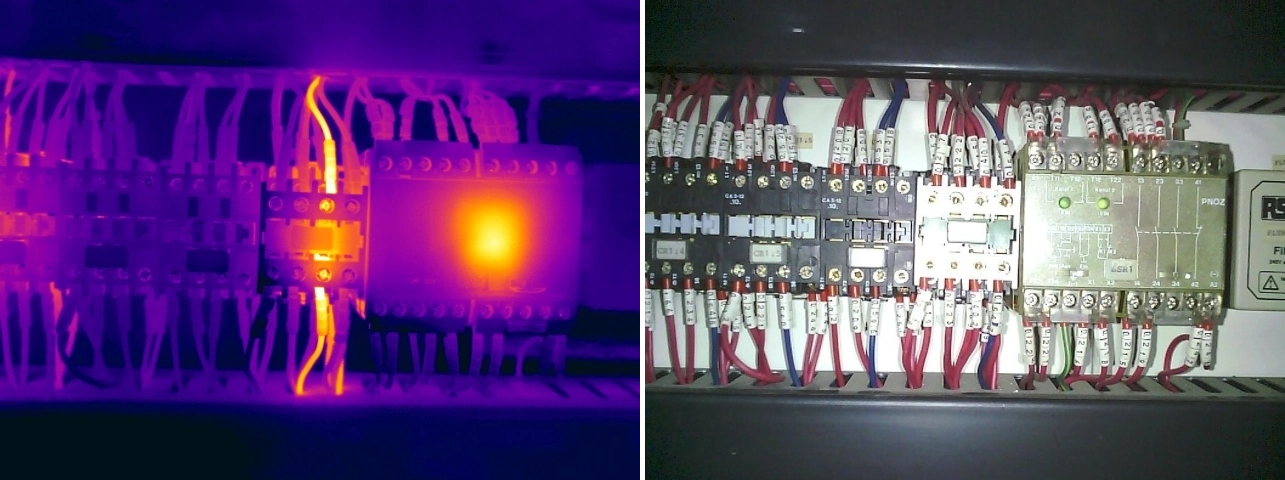
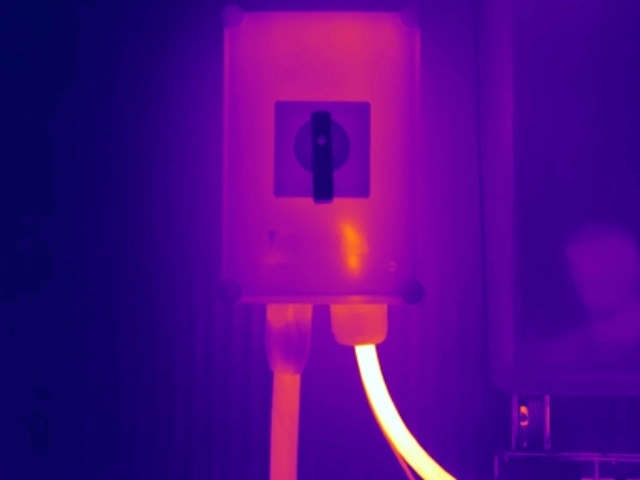
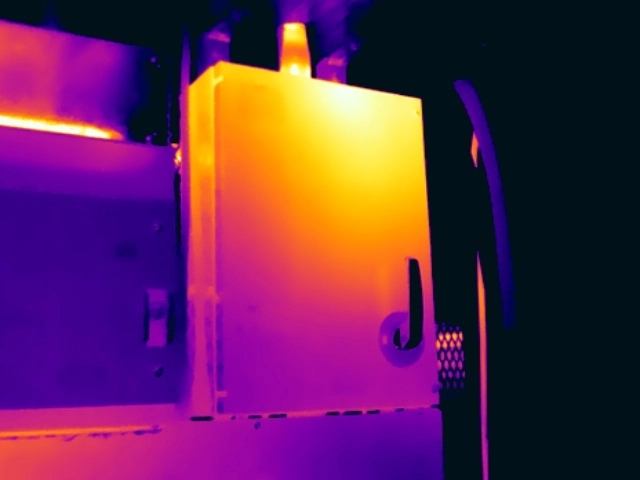
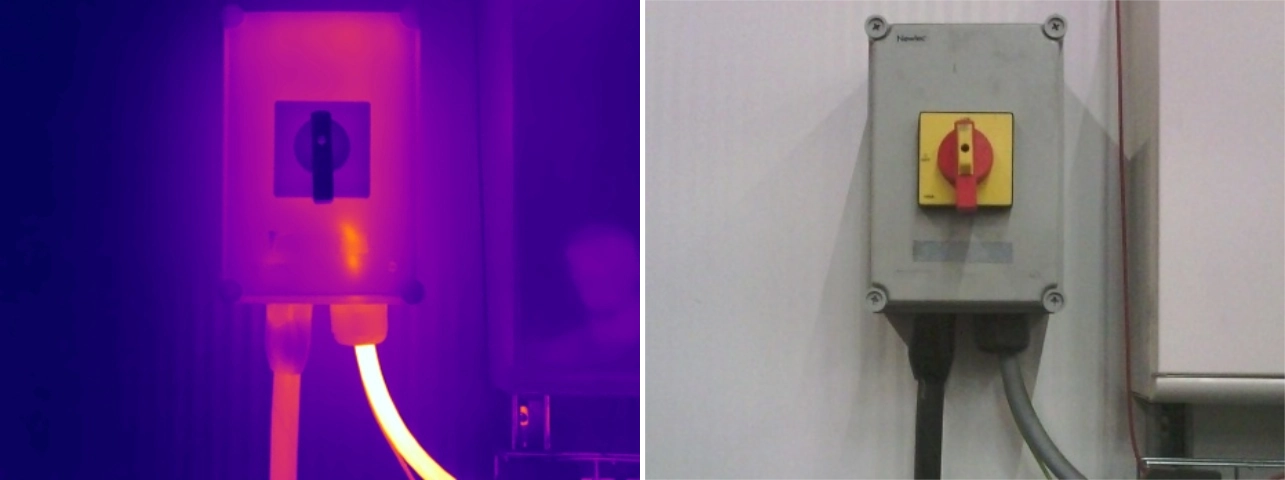
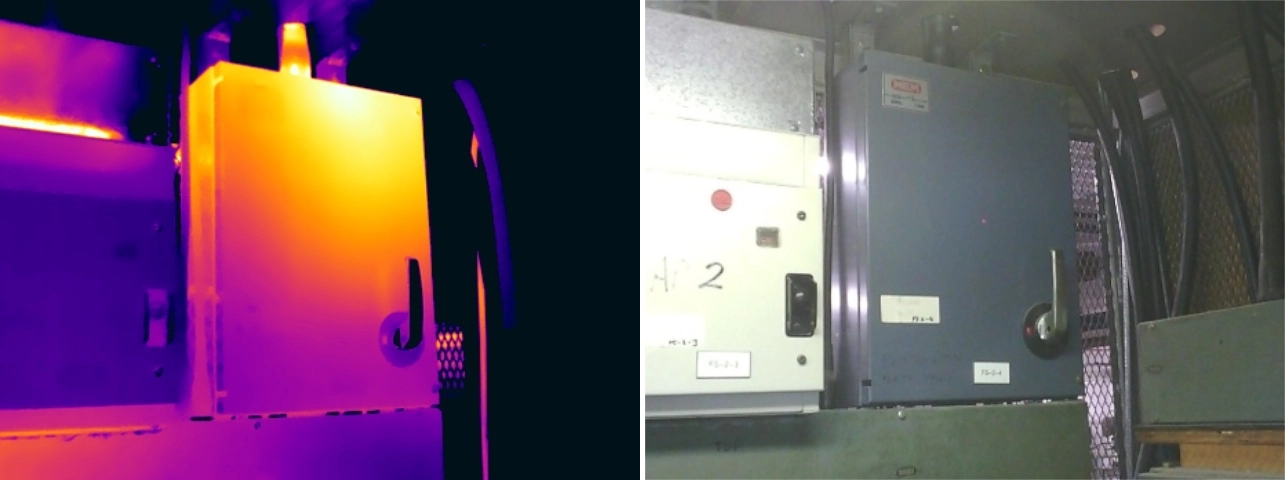
Loose electrical connections are among the most common findings during electrical thermal imaging surveys. They can occur at cable terminations, bolted joints, busbar connections and component terminals throughout low-voltage and high-voltage electrical systems.
Explore additional examples, interpretation guidance and corrective-action considerations in our complete guide to loose electrical connections identified by thermal imaging.
Over time, vibration, thermal cycling, mechanical movement and repeated maintenance activity can reduce connection integrity. As the contact area deteriorates, electrical resistance increases and localised heat develops at the connection point. The resulting thermal pattern may vary according to the component design, electrical load and stage of deterioration, which is why comparison with adjacent phases or similar equipment operating under comparable conditions is important. If left unaddressed, the condition can continue to worsen and may lead to insulation damage, arcing, component failure or an unplanned outage.
High resistance connections are a common thermal anomaly identified during electrical thermal imaging surveys. Whilst loose connections are often a contributing factor, high resistance conditions can also develop as a result of corrosion, contamination, conductor damage, poor workmanship or age-related deterioration.
Learn how corrosion, poor contact, damaged conductors and deteriorated interfaces create high-resistance thermal anomalies. Read the high-resistance electrical connections guide.
As electrical resistance increases, additional energy is dissipated as heat, causing localised temperature rises at the affected connection. If left unresolved, these elevated temperatures can accelerate component degradation and increase the likelihood of equipment failure.
From a thermographic perspective, high resistance faults frequently appear as isolated hotspots that are significantly hotter than adjacent connections carrying comparable electrical loads, making them particularly well suited to detection using thermal imaging.
Overloaded circuits are regularly identified during electrical thermal imaging surveys and represent one of the most valuable findings that thermography can provide. Unlike many thermal anomalies, overheating caused by excessive electrical loading does not necessarily indicate a fault within the equipment itself. Instead, it often highlights changing operational demands, inadequate system capacity, poor load distribution or equipment that is no longer appropriately sized for its application.
Explore load-related heating, capacity concerns and the difference between whole-circuit overloading and local connection defects. Read the overloaded electrical circuits guide.
As electrical current increases, conductors, protective devices and connected equipment generate additional heat. Where circuits consistently operate close to or beyond their intended design capacity, temperatures can rise significantly, accelerating insulation deterioration and reducing equipment life expectancy.
Thermal imaging provides a valuable means of identifying overloaded circuits under normal operating conditions, allowing organisations to better understand asset utilisation and detect potential capacity issues before they result in failures or operational disruption.
Phase imbalance is a common issue within three-phase electrical systems and is regularly identified during thermal imaging surveys. Whilst not necessarily a fault in itself, phase imbalance can be an indicator of poor load distribution, changing operational demands, system modifications or equipment operating outside its intended design parameters.
Learn how unequal phase loading appears thermally and why electrical measurements are needed to establish the underlying cause. Read the phase imbalance thermal imaging guide.
Under normal conditions, electrical loads should be distributed as evenly as possible across all three phases. When one phase carries significantly more current than the others, it will typically operate at a higher temperature. Over time, this can reduce efficiency, increase electrical losses and place additional stress on conductors, transformers, switchgear and associated equipment.
Thermal imaging provides a practical method of identifying phase imbalance under normal operating conditions by highlighting temperature differences between comparable conductors, terminations and protective devices.
Circuit breakers are critical protective devices designed to automatically disconnect electrical circuits under fault conditions. Over time, repeated operation, high fault currents, ageing components and normal wear can cause internal contacts, terminals and associated components to deteriorate.
Review thermal examples involving MCBs, RCBOs, MCCBs and motor-protection devices, including the limits of thermography. Read the failing circuit breakers thermal imaging guide.
As resistance increases within the breaker or its connections, abnormal heat can develop. Thermal imaging provides an effective method of identifying these issues whilst equipment remains energised and operating under normal load conditions, allowing developing failures to be detected before protective devices cease to operate as intended.
Switchgear is among the most critical electrical infrastructure found within industrial facilities, commercial buildings, data centres and high voltage substations. Responsible for controlling, protecting and isolating electrical circuits, switchgear is expected to operate reliably for many years, often within demanding operating environments.
Explore abnormal switchgear patterns across LV main switches, RMUs and 11kV equipment. Read the deteriorating LV and HV switchgear guide.
Over time, mechanical wear, contact deterioration, contamination, moisture ingress and repeated switching operations can affect the condition of switchgear components. These issues frequently develop gradually and may remain undetected during routine visual inspections. Thermal imaging provides a non-invasive method of assessing switchgear condition whilst equipment remains energised and operating under normal load conditions.
By identifying abnormal thermal patterns at an early stage, thermal imaging can help maintenance teams address developing issues before they escalate into equipment failures, outages or more significant electrical incidents.
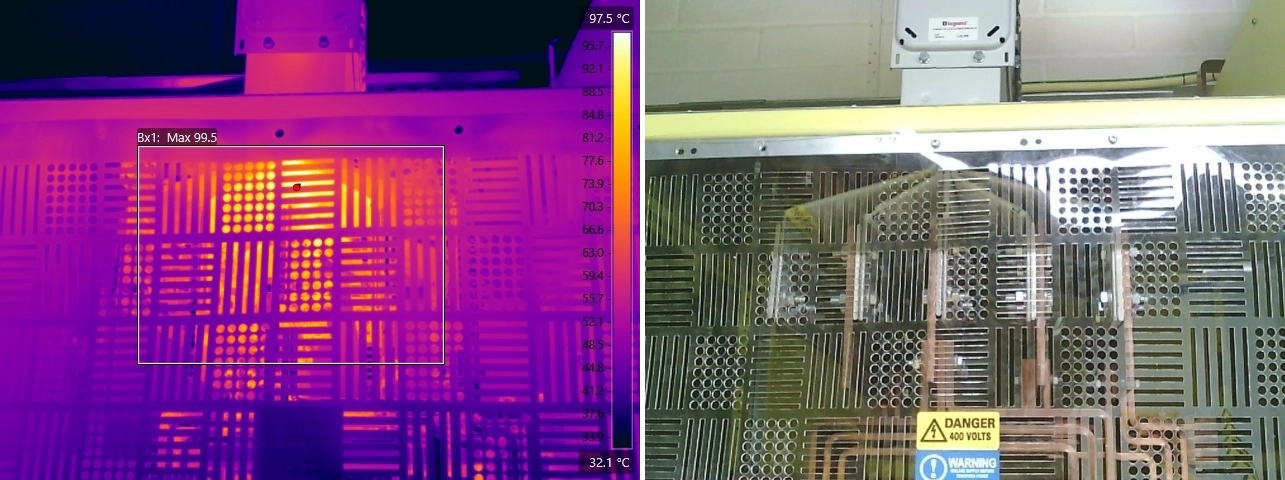
Busbar systems are widely used throughout industrial facilities, data centres, commercial buildings and high voltage substations to distribute large electrical loads efficiently. Because busbars often carry significant currents, even minor defects at joints and connections can generate substantial heat and create serious reliability concerns.
Learn how thermography identifies interconnector, tap-off and high-voltage busbar joint defects. Read the busbar joint defects thermal imaging guide.
Busbar joint defects typically develop due to loose connections, inadequate installation practices, thermal cycling, mechanical movement or age-related deterioration. As connection resistance increases, localised heating can develop at the affected joint, often long before visible signs of damage appear.
Thermal imaging is particularly effective at identifying busbar joint defects because the affected connection will frequently operate at a significantly higher temperature than adjacent joints carrying similar electrical loads.
Transformers are among the most critical assets within electrical distribution systems, serving industrial facilities, commercial sites, data centres and high voltage substations. Because these assets often operate continuously and carry significant electrical loads, developing defects can have serious consequences for reliability, operational continuity and equipment lifespan.
Explore transformer cooling faults, liquid-level patterns, radiator restrictions, bushing anomalies and connection defects. Read the transformer defects thermal imaging guide.
Thermal imaging is particularly effective for assessing transformer condition because it allows thermographers to evaluate both electrical connections and cooling performance whilst the transformer remains energised and operating under normal load conditions. Abnormal temperature patterns can indicate developing problems ranging from connection defects and load imbalance through to cooling system deficiencies and excessive loading.
Importantly, transformer-related thermal anomalies do not always appear as hotspots. In some cases, unexpectedly cool areas, such as blocked radiators or failed cooling fans, can indicate defects that may ultimately result in overheating elsewhere within the transformer.
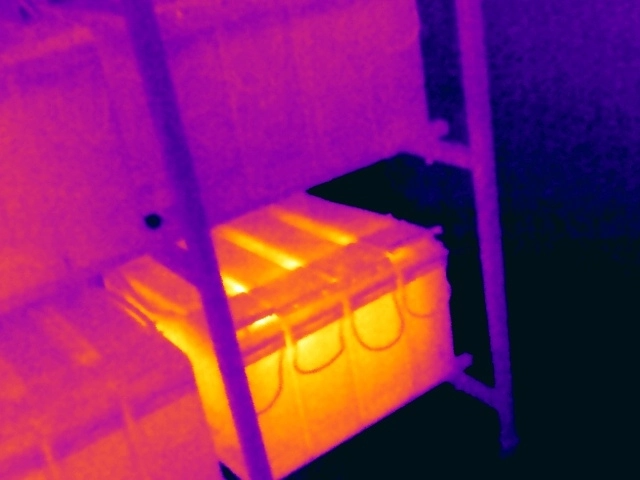
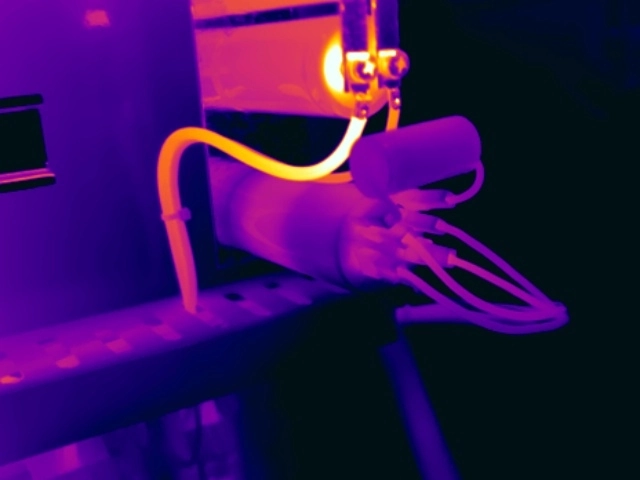
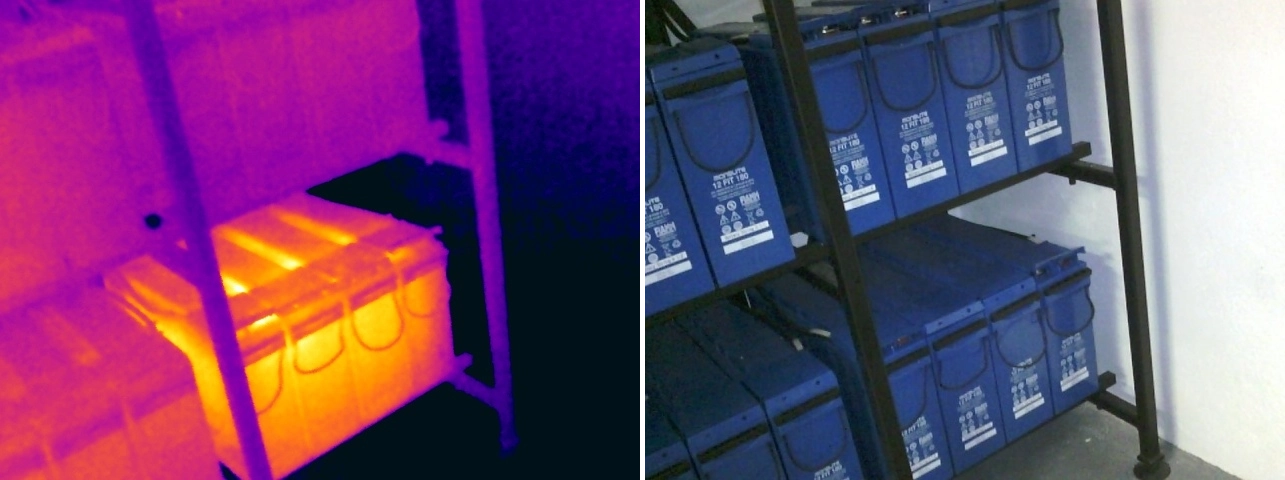
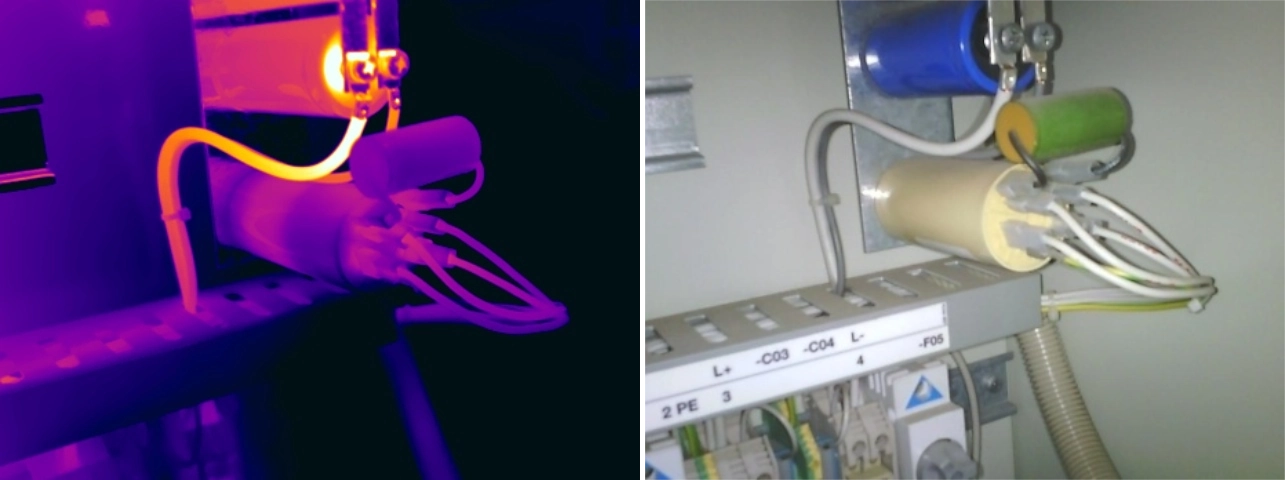
Uninterruptible Power Supply (UPS) systems play a critical role in maintaining power continuity within data centres, hospitals, commercial buildings, industrial facilities and other mission-critical environments. Because UPS systems are designed to support essential equipment during power disturbances, failures within the UPS or its associated distribution infrastructure can have significant operational consequences.
Review battery-bank, capacitor, connection and critical-power distribution anomalies, including unexpectedly cool failed components. Read the UPS system defects thermal imaging guide.
Thermal imaging is particularly effective for assessing UPS systems because inspections can be completed whilst the equipment remains energised and operating under normal load conditions. By identifying abnormal thermal patterns within power connections, protective devices, battery systems and distribution equipment, thermographers can detect developing issues before they impact system reliability.
Unlike many electrical assets, UPS systems often operate continuously and experience varying load conditions, making periodic thermal inspections an important part of a proactive maintenance strategy.
Contactors, relays and control equipment form the backbone of many industrial and commercial control systems, providing the switching and protection functions required to operate motors, pumps, conveyors, HVAC systems and other electrically driven assets. Whilst these components are often relatively small compared to switchgear or transformers, their failure can result in significant operational disruption.
Explore contact deterioration, coil degradation, control-panel connections and PCB-mounted relay component heating. Read the contactors, relays and control equipment thermal imaging guide.
Thermal imaging is particularly effective at identifying developing issues within control equipment because the effects of contact wear, deteriorating connections and excessive loading frequently manifest as abnormal heat patterns long before operational problems become apparent. By identifying these thermal anomalies early, organisations can address defects before they lead to equipment failure, process interruptions or unplanned downtime.
Switch fuses and isolators play a critical role within electrical distribution systems, providing a safe means of isolation whilst protecting circuits and connected equipment from fault conditions. These devices are widely installed throughout industrial facilities, commercial buildings, manufacturing plants, distribution centres and high voltage substations.
Learn how connection, contact and pivot defects present across LV switch fuses and 33kV or 132kV isolators. Read the switch fuses and isolators thermal imaging guide.
Over time, mechanical wear, repeated operation, loose connections, corrosion and contact deterioration can affect their performance. As contact resistance increases, abnormal heating can develop within the device or at associated cable terminations. Thermal imaging provides an effective method of identifying these developing issues whilst equipment remains energised and operating under normal load conditions.
Because switch fuses and isolators are often installed within critical power distribution circuits, identifying thermal anomalies at an early stage can help prevent equipment failure, unplanned outages and costly operational disruption.
Use the dedicated guides below for fault-specific thermal examples, interpretation considerations, affected equipment, risks and follow-up guidance.
Explore real thermal examples, causes, interpretation guidance and corrective-action considerations for loose connection anomalies.
Read the GuideLearn how corrosion, poor contact, damaged conductors and deteriorated interfaces create high-resistance thermal anomalies.
Read the GuideExplore load-related heating, capacity concerns and the difference between whole-circuit overloading and local connection defects.
Read the GuideLearn how unequal phase loading appears thermally and why electrical measurements are needed to establish the underlying cause.
Read the GuideReview thermal examples involving MCBs, RCBOs, MCCBs and motor-protection devices, including the limits of thermography.
Read the GuideExplore abnormal switchgear patterns across LV main switches, RMUs and 11kV equipment.
Read the GuideLearn how thermography identifies interconnector, tap-off and high-voltage busbar joint defects.
Read the GuideExplore transformer cooling faults, liquid-level patterns, radiator restrictions, bushing anomalies and connection defects.
Read the GuideReview battery-bank, capacitor, connection and critical-power distribution anomalies, including unexpectedly cool failed components.
Read the GuideExplore contact deterioration, coil degradation, control-panel connections and PCB-mounted relay component heating.
Read the GuideLearn how connection, contact and pivot defects present across LV switch fuses and 33kV or 132kV isolators.
Read the GuideNot all thermal anomalies require the same level of response. Following inspection, identified issues are assessed based on their thermal characteristics, potential failure mechanisms, operational impact and associated risk.
The severity classification assigned to each anomaly helps maintenance teams prioritise corrective actions and allocate resources appropriately.
Urgent Action Required
Priority 1 anomalies present a significant risk to the continued safe operation of the equipment and require urgent corrective action.
These defects are typically associated with severe thermal anomalies that may indicate an increased risk of equipment failure, unplanned outage, electrical arcing or fire.
Remedial Action at the Earliest Opportunity
Priority 2 anomalies indicate developing defects that require corrective action at the earliest practical opportunity.
Whilst the immediate risk is generally lower than a Priority 1 anomaly, the condition may continue to deteriorate and could ultimately lead to equipment damage, reduced reliability or operational disruption if left unaddressed.
Remedial Action During Planned Maintenance
Priority 3 anomalies identify developing issues that should be addressed during the next planned maintenance activity.
These findings typically represent lower-risk defects that should continue to be monitored and rectified as part of routine maintenance programmes to prevent further deterioration.
Further Assessment Required
The Monitor classification is typically applied to previously identified anomalies where it has not been possible to fully assess the condition during the current inspection.
This commonly occurs when the affected equipment is not operating under sufficient load conditions to allow a meaningful comparison with previous survey results. In these situations, the anomaly should be re-assessed during a future inspection when suitable operating conditions are available.
Developing electrical faults can occur across all sectors and facility types.
Red Current regularly delivers electrical thermal imaging surveys across the following environments:

Learn how electrical thermal imaging supports reliability, maintenance planning and risk reduction within data centres.
Discover More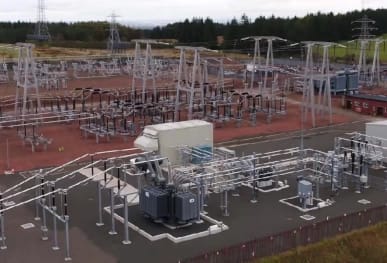
Learn how electrical thermal imaging supports reliability, maintenance planning and risk reduction within high voltage substations.
Discover More
Learn how electrical thermal imaging supports reliability, maintenance planning and risk reduction within manufacturing facilities.
Discover More
Learn how electrical thermal imaging supports reliability, maintenance planning and risk reduction within food manufacturing facilities.
Discover More
Learn how electrical thermal imaging supports reliability, maintenance planning and risk reduction within distribution centres.
Discover More
Learn how electrical thermal imaging supports reliability, maintenance planning and risk reduction within commercial offices.
Discover More
Learn how electrical thermal imaging supports reliability, maintenance planning and risk reduction within hospitals & healthcare facilities.
Discover More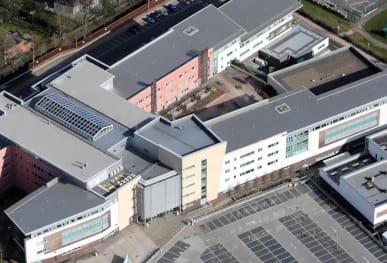
Learn how electrical thermal imaging supports reliability, maintenance planning and risk reduction within schools, colleges & universities.
Discover More
Learn how electrical thermal imaging supports reliability, maintenance planning and risk reduction within shopping centres & retail parks.
Discover MoreWhile the equipment may differ between these environments, the objective remains the same: identifying faults early and reducing operational risk.
Loose electrical connections and high-resistance terminations are among the most frequently identified thermal anomalies. These defects often develop gradually and can generate significant heat long before visible signs of deterioration become apparent.
Not necessarily. While many thermal anomalies are associated with developing electrical defects, elevated temperatures can also be caused by excessive electrical loading, phase imbalance or changing operational conditions. Likewise, some defects may present as unexpectedly cool areas, such as blocked transformer radiators or failed cooling fans. Thermal imaging assesses abnormal thermal behaviour rather than simply identifying hotspots.
Yes. Thermal imaging is highly effective at identifying overloaded circuits operating under normal load conditions. Elevated temperatures may indicate that conductors, protective devices or electrical equipment are carrying higher levels of current than originally intended, helping organisations identify potential capacity and reliability issues before failures occur.
Yes. Thermal imaging can identify the thermal effects of phase imbalance by highlighting temperature differences between conductors, busbars and protective devices operating within the same three-phase system. Significant temperature differences between phases often indicate uneven load distribution and warrant further investigation.
Yes. Thermal imaging can identify a wide range of transformer-related anomalies including overheating connections, load imbalance, cooling system deficiencies and abnormal temperature distribution across transformer components. Inspections are particularly effective when transformers are operating under normal load conditions.
Yes. Thermography is not solely used to identify hotspots. Thermal imaging can also identify abnormal cooling performance such as blocked transformer radiators, failed cooling fans, restricted airflow or impaired oil circulation systems. In these cases, the issue may be identified through an unexpected thermal pattern rather than elevated temperatures alone.
There is no single temperature threshold that automatically indicates a fault. The significance of a thermal anomaly depends upon many factors, including equipment type, loading conditions, component criticality, operating environment and potential failure consequences. Experienced thermographers assess findings within their wider operational context rather than relying solely on temperature measurements.
Thermal anomalies are prioritised based on their severity, operational significance and associated risk. Factors such as equipment criticality, loading conditions, potential failure mechanisms and safety implications are all considered when assigning Priority 1, Priority 2, Priority 3 or Monitor classifications.
For broader information about survey preparation, qualifications, reporting, inspection frequencies and compliance, visit our Electrical Thermal Imaging Survey FAQs.
Electrical thermal imaging surveys provide a powerful method of identifying developing faults before they result in equipment failure, downtime or safety incidents. By detecting issues at an early stage, organisations can improve electrical reliability, support predictive maintenance programmes and reduce the risk of costly operational disruption.
Whether managing a data centre, manufacturing facility, hospital, distribution centre or commercial property portfolio, thermal imaging delivers the actionable insight required to make informed maintenance decisions and protect critical electrical assets.
Contact us to request pricing, obtain a sample report or discuss an electrical thermal imaging survey with one of our specialists.
Please complete the form below to let us know your requirements. We’ll then provide detailed information on costs and our inspection process.
Please complete the form below to let us know your requirements. We’ll then provide detailed information on costs and our inspection process.
Please complete the form below to let us know your requirements. We’ll then provide detailed information on costs and our inspection process.
Please complete the form below to let us know your requirements. We’ll then provide detailed information on costs and our inspection process.
Please complete the form below to let us know your requirements. We’ll then provide detailed information on costs and our inspection process.
Please complete the form below to let us know your requirements. We’ll then provide detailed information on costs and our inspection process.
Please complete the form below to let us know your requirements. We’ll then provide detailed information on costs and our inspection process.
Please complete the form below to let us know your requirements. We’ll then provide detailed information on costs and our inspection process.
Please complete the form below to let us know your requirements. We’ll then provide detailed information on costs and our inspection process.
Please complete the form below to discover our latest offers on the camera you're interested in.
Please fill out this form for us to generate an invoice. Call us on 0118 3320819 or email your enquiry to our team who are on hand to assist.
Please complete the form below to discover our latest offers on the camera you're interested in.
Please complete the form below to let us know your requirements. We’ll provide detailed information on pricing, availability, delivery options, and our thermal camera hire process.
Once submitted, a member of our team will get in touch with tailored guidance to support your needs.
 ELECTRICAL APPLICATIONSData Centre Thermal InspectionsHigh Voltage Substation SurveysManufacturing Facility InspectionsHospital Thermal InspectionsFood Manufacturing InspectionsDistribution Centre InspectionsOffice Building InspectionsSchool & University InspectionsShopping Centre InspectionsOffshore Oil and Gas Surveys
 OTHER APPLICATIONSUnder Floor Heating InspectionsBuilding Heatloss Surveys


